THE STRUCTURAL TRANSFORMATION IN JAPAN, INDONESIA AND MALAYSIA FROM 1880 TO 2010:
PART 1-DATA AND TRENDS
PART 1-DATA AND TRENDS
C. Peter Timmer, Harvard University
A powerful pathway of structural transformation is experienced by all successful developing countries. This structural transformation involves four main features:
- A falling share of agriculture in economic output and employment;
- A rising share of urban economic activity in industry and modern services;
- A migration of rural workers to urban settings, and
- A demographic transition in birth and death rates that initially always leads to a spurt in population growth before a new equilibrium is reached.i
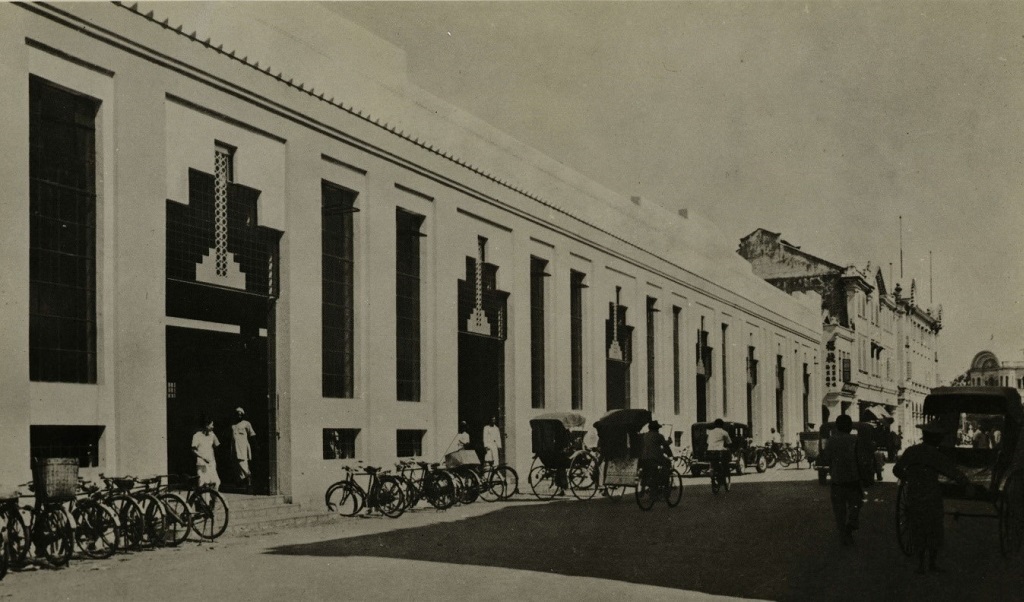
Rising urbanization and urban economic activity in Malaya
Source: The National Archives of Malaysia
Source: The National Archives of Malaysia
Pressures generated along the transformation pathway have led to diverse policy approaches designed to maintain political support for governments in power, often by helping lagging rural households. Sometimes policies were needed to keep the poor from falling off the pathway altogether.
Making sure the poor are connected to both the structural transformation and to the policy initiatives designed to ameliorate the distributional consequences of rapid transformation has turned out to be a major challenge for policy makers since the middle of the 20th century. There are successes and failures, and the historical record illuminates what works and what does not. Malaysia has a particularly instructive historical record, especially when compared with two important regional neighbors-Japan and Indonesia.ii Earlier research developed the history of structural transformation from 1880 to 2010 for Japan and Indonesia (Timmer, 2015). The purpose of this article, presented in two separate parts, is to include Malaysia in a similar long-run comparison.
The statistical difficulties in conducting this exercise are enormous. Japan and Indonesia were coherent economic entities in 1880, even if modern national income accounts had not been invented. Still, the data for approximating these accounts are fairly rich for these two countries. The same cannot be said for Malaysia, which has had shifting governance structures and regional integrity until the Federation of Malaya gained independence in 1957 and the Federation of Malaysia was formed in 1963. The data here draw heavily on the research project led by Sultan Nazrin Shah, including the recently published volume from Oxford University Press (Sultan Nazrin Shah, 2017).
Table 1 presents the basic data used for the analysis. It shows decade estimates for the share of Gross Domestic Product (GDP) originating in the agricultural sector (AgGDPshr), the share of the labour force working in the agricultural sector (AgEMPshr), the difference between these two shares, (AgGAPshr) which is typically negative because the share of the labour force working in agriculture is nearly always larger than the contribution of those workers to GDP. The implication, of course, is that labour productivity in the agricultural sector is lower than labour productivity in non-agriculture. Closing this gap in labour productivity between the two sectors is one of the main drivers of economic growth (Lewis, 1954). Historically, however, the GAP has tended to widen in the early stages of rapid economic growth because gains in labour productivity in manufacturing tend to outpace gains in labour productivity on farms. Only better integrated labour markets, and significant movements of surplus labour from rural to urban areas, have led to narrowing the GAP.
Table 1 Basic historical data on structural transformation for Japan, Indonesia and Malaysia
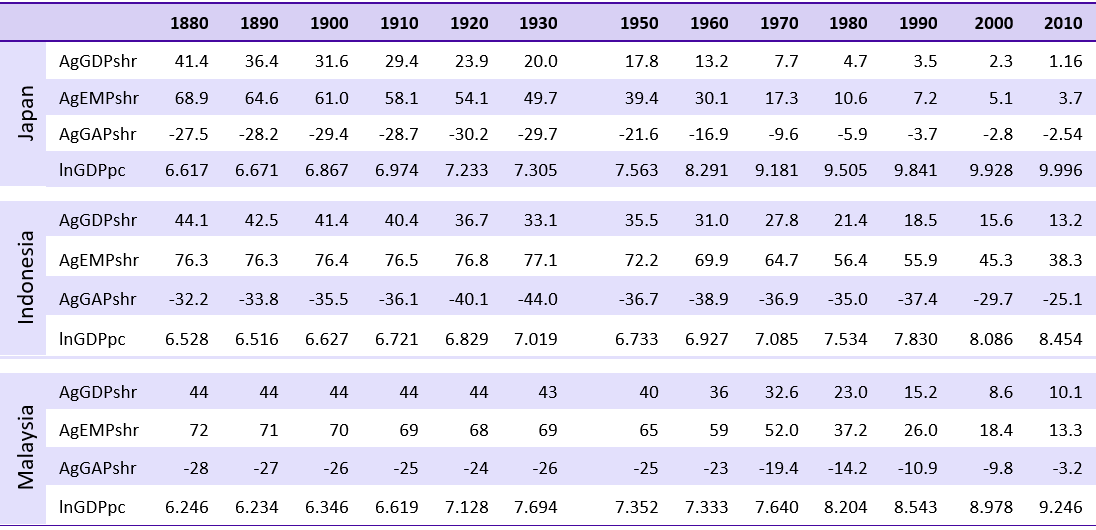
The fourth variable shown in Table 1 is the logarithm of per capita GDP for each decade. The data for this variable draw heavily on Maddison (2001) and Sultan Nazrin Shah (2017). The income data have been re-indexed to a 1990 base using Geary-Khamis multilateral PPPs (see Maddison (1995) for a full explanation). The Malaysian data use the series from 1900 to 1939 and from 1950 to 2016 developed by Sultan Nazrin Shah, but are re-scaled to the Maddison benchmarks. In principle, the income data should be comparable across countries and time. In fact, there is much guesswork in the data before 1920 for all three countries, although the margin of error is significantly wider for Malaya.
Between 1920 and 1970 the data become more trustworthy, although again, the Malaysian data have been interpolated from a wide variety of original sources and are not as complete in coverage as the Japanese and Indonesian data. From 1970 to 2010, the data are about as good as national income statistics get, and should be directly comparable. Fortunately, much of the important 'action' in the structural transformation variables starts about 1970, so we have a reasonably clear picture of how the transformation is proceeding.
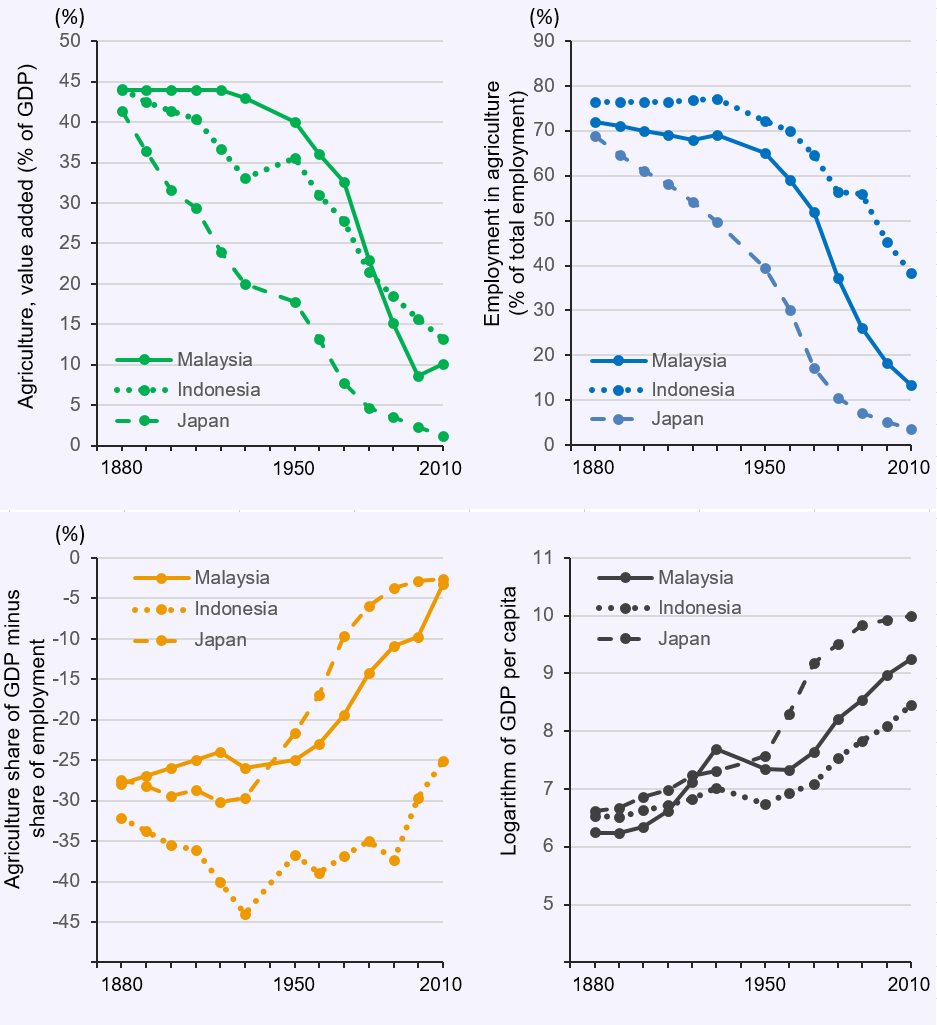
Figure 1 shows this picture in dramatic fashion: each of the four variables is shown in a separate quadrant. The upper left quadrant plots agricultural value added as a share of overall GDP, for each of the three countries. There is a sharp decline over time for all three countries, but the steepest fall is for Malaysia from 1960 to 2000. The upper right quadrant shows similar paths for the share of employment in agriculture. The decline is uniformly less rapid than for value added, and again Malaysia's decline is especially steep. The lower left quadrant then plots the differences between these two shares. This gap is especially large for Indonesia: Malaysia reached parity with Japan in 2010. Finally, the lower right quadrant plots per capita GDP from 1880 to 2010. Not surprisingly, Japan uniformly has the highest per capita GDP (except in 1930, when Malaysia temporarily surpassed it in purchasing power parity terms). Both Malaysia and Indonesia are on more rapid growth paths than Japan.
Figure 1 Components of long-run structural transformation, Malaysia, Indonesia and Japan, 1880-2010
A quite different perspective but using the same data is shown in Figure 2. Here the AgGPDshr and AgEMPshr variables are shown on the positive vertical axis, while the AgGAPshr variable is shown on the negative vertical axis. The horizontal axis measures the logarithm of per capita GDP, instead of decades (with economic growth, the two are correlated). Two features of the historical experience of all three countries are immediately obvious. First, both AgGDPshr and AgEMPshr decline quite steadily as per capita GDP increases. Indeed, they approach zero at high income levels, a 'world without agriculture' (Timmer, 2009).
Figure 2 Long-run patterns of structural transformation, Malaysia, Indonesia and Japan, 1880-2010
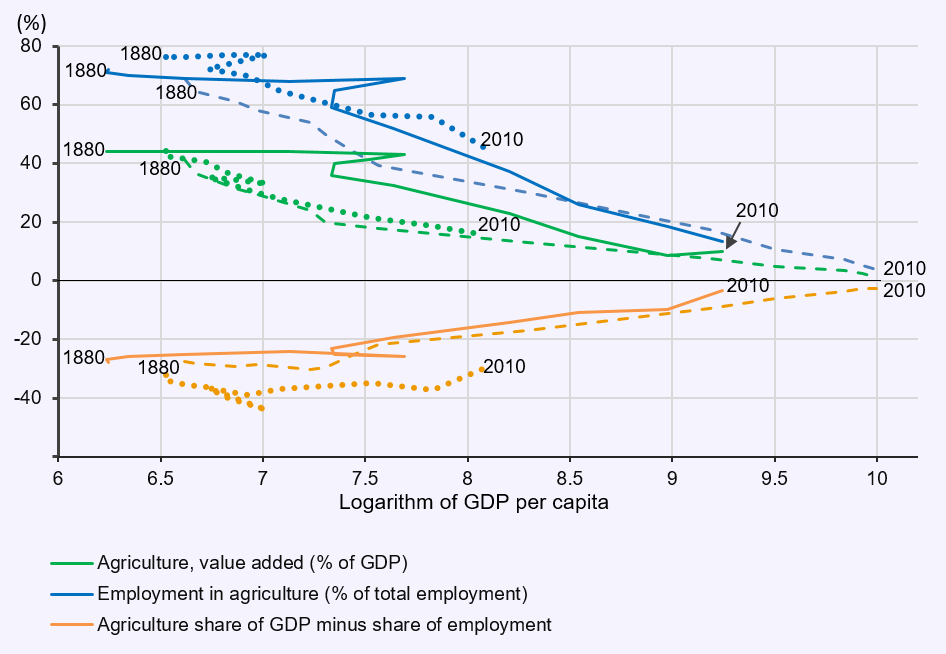
Note: Solid lines indicate Malaysia's trajectory; dotted show Indonesia's trajectory; dashes show Japan's trajectory
Second, a significant GAP exists between these two variables in the early stages of development (and Indonesia is poor enough that the earlier mentioned tendency of the GAP to increase in the early stages of development is quite visible-the data for Malaysia are not reliable enough to make a similar statement with confidence, and the turning point for the GAP in Japan came well before 1880). The tendency for this GAP to narrow at higher income levels is one of the surest signs of a maturing economy, as labour and capital markets become integrated between rural and urban areas.
Indeed, the final outcome of the structural transformation, already visible on the horizon in rich countries, is an economy and society where agriculture as an economic activity has no distinguishing characteristics from other sectors, at least in terms of the productivity of labour and capital, or the location of poverty. This stage also shows up in Figure 2, as the gap in labour productivity between agricultural and non-agricultural workers approaches zero when incomes are high enough.
Several aspects of the Malaysian data should be noted. First, all the data before 1900 are interpolated based on later historical trends and estimates from Maddison (2001) for 1870 and 1913. The data for AgGDPshr and AgEMPshare, in particular, are crude guesses based on comparable historical experience in the region and plausible trends backward from 1900. Lacking information on changes in agricultural incomes for the earlier periods, the agGDPshr is set at 44 per cent from 1880 to 1920, when more accurate data become available. As a consequence, the gradually falling GAP from 1880 to 1920 is a direct consequence of the assumption that agEMPshr falls smoothly from 72 percent in 1880 to 68 per cent in 1920. At best, the data for these early decades provide a very broad and general picture of what might have been happening to the overall structure of the Malayan economy, and little specific analysis should be directed at this era.
Somewhat more confidence can be placed in the data on GDP per capita, especially its growth from 1900 to 1930. This was a remarkable period for the Malayan economy, as demand for tin and rubber expanded rapidly, and British colonial policy facilitated investments in the production and export of both commodities. It is important to note that relatively little of this expansion in economic output actually remained with Malayan households, as most of the profits went to London instead. Still, it is noteworthy that per capita GDP in Malaya surpassed that in Japan in 1930, the first (and only) decade when the Malayan economy was larger in per capita terms (on a purchasing power parity basis).
Next, Malaysia (and Indonesia) suffered badly during the Great Depression and World War II, and recovered very slowly in the 1950s and 1960s. This was the era of the Japanese Miracle, when that country, after the devastation of World War II, pulled ahead on the basis of rapid expansion of manufactured exports. Japanese economic growth has slowed since 1990 and an important question is whether Malaysia can continue to catch up. The possibility that the country is now caught in a middle income trap has been discussed in an article onthis website by Dwight Perkins (2017).
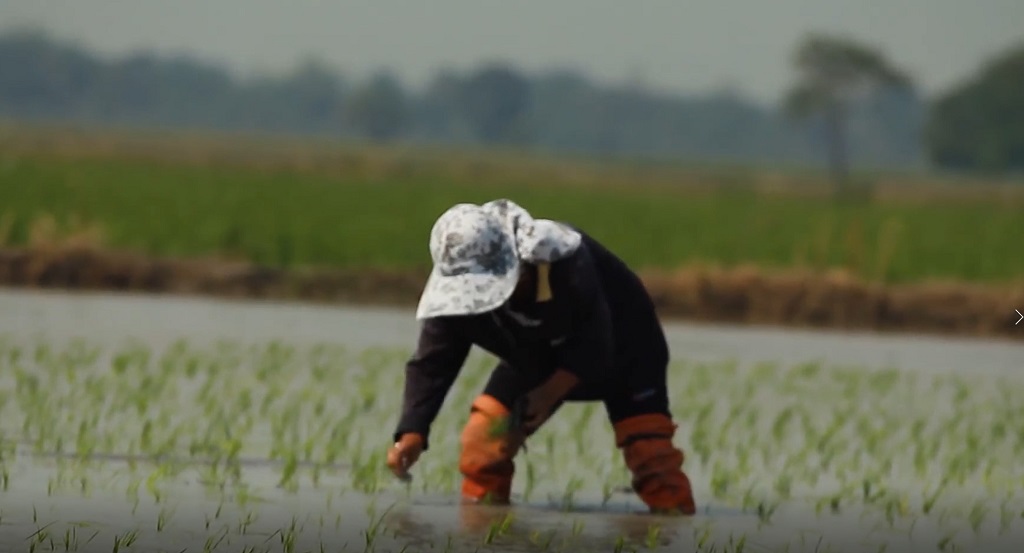
Improving rural incomes by managing the distributional impact of rapid structural transformation
Source: Laura Low
Source: Laura Low
Finally, Malaysia experienced a sharp uptick in its AgGDPshr in 2010, although AgEMPshr continued to fall. As a result, the AgGAPshr fell very sharply, pointing toward significantly improved rural incomes. Further investigation is needed to be sure of the reason, but the sharp increases in world market prices after 2007 for the agricultural commodities that Malaysia exports, especially palm oil and rubber, are likely to be the main cause. Rice prices also rose, helping the country's remaining paddy farmers. The role of agricultural policies in managing the distributional impact of rapid structural transformation is one of the main themes of Part 2 of this article.
Endnote:
iThe demographic transition is especially complex in Malaysia because of significant ethnic differences in changing fertility rates and will be discussed in a forthcoming ehm.my website article.
iiI refer to Malaya or Malaysia, whichever seems most appropriate. Much of the discussion refers to earlier historical experience of Malaya, what is now referred to as Peninsular Malaya.
Further reading:
Anderson, Kym and Yujiro Hayami. 1986. The Political Economy of Agricultural Protection. Sydney: Allen and Unwin.
Besley, Tim, and Louise Cord, eds. 2006. Operationalizing Pro-Poor Growth: Synthesis and Country Experiences. London: Palgrave MacMillan.
Goldman, Richard H. 1975. 'Staple Food Self-Sufficiency and the Distributive Impact of Malaysian Rice Policy'. Food Research Institute Studies, Vol. XIV, No. 3, pp. 251-293.
Leete, R. 2017. 'Economic Growth and Inequality in Malaysia: Looking Back; Looking Around and Looking Forward', paper presented at the Forum to Commemorate Tan Sri Just Faaland's Contribution to the Socio-Economic Development of Malaysia, April 2017, Kuala Lumpur.
Lewis, W. Arthur (1954). 'Economic Development with Unlimited Supplies of Labor'. The Manchester School, 22: pp. 3-42.
Maddison, Angus. 1995. Monitoring the World Economy: 1820-1992. Paris: Development Centre of the Organization for Economic Co-operation and Development (OECD).
_____ 2001. The World Economy: A Millennial Perspective. Paris: Development Centre of the Organization for Economic Co-operation and Development (OECD).
Perkins, Dwight H. 2017. 'Malaysia: The Challenge of Avoiding the Middle Income Trap'. Available at www.ehm.my
Sivalingam, G. 1993. Malaysia's Agricultural Transformation. Selangor Darul Ehsan, Malaysia: Pelanduk Publications.
Sultan Nazrin Shah. 2017. Charting the Economy: Early 20th Century Malaya and Contemporary Malaysian Contrasts. Kuala Lumpur: Oxford University Press.
Timmer, C. Peter. 1988. 'The Agricultural Transformation' in H. Chenery and T.N. Srinivasan ). Handbook of Development Economics. Vol. 1. Amsterdam: North-Holland, pp. 275-331.
_____ 2002. 'Agriculture and Economic Growth', in Bruce Gardner and Gordon Rausser (eds.). Handbook of Agricultural Economics, Vol. IIA. Amsterdam: North-Holland. pp. 1487-1546.
_____ 2004. 'The Road to Pro-Poor Growth: The Indonesian Experience in Regional Perspective'. Bulletin of Indonesian Economic Studies, Vol. 40, No. 2, August 2004, pp. 177-207.
_____ 2009. A World Without Agriculture: The Structural Transformation in Historical Perspective. Wendt Distinguished Lecture. Washington, DC: American Enterprise Institute.
_____ 2015. 'The Dynamics of Agricultural Development and Food Security in Southeast Asia: Historical Continuity and Rapid Change' in Ian Coxhead (ed). Handbook of Southeast Asian Economics. London and New York: Routledge. pp. 89-113.
Timmer, C. P. and Selvin, A. 2008. 'The Structural Transformation as a Pathway out of Poverty: Analytics, Empirics and Politics', Working Paper 150. Center for Global Development, Washington, DC.
World Bank. 2007. World Development Report 2008: Agriculture for Development. Washington, DC.