Articles
Malaysia endeavoured to reduce socio-economic inequalities between ethnic communities from independence in 1957, and intensified efforts after the New Economic Policy (NEP) in 1971. Numerous government programmes were implemented over the following decades to redress ethnic inequalities, including in education, occupation, poverty, and equity ownership. Malaysia has studiously monitored progress in reducing ethnic disparities, especially in the last three of these areas. 1

Income is an effective indicator of well-being. As household income rises, education, health, and wealth generally improve—albeit not automatically and not necessarily at the same rate. Nonetheless, household income gaps provide a holistic reflection of inequality. The development plans of the 1970s and 1980s recognized the importance of household income differentials but did not monitor interethnic disparities.

This shortfall was due to the primacy of reducing poverty among income-related policy objectives, and perhaps the lack of authoritative data. However, as household income surveys were regularly conducted from the 1980s, official publications provided ad hoc snapshots of the main ethnic groups’ income levels. From the mid-1990s, Malaysia’s development plans tracked household income averages for the Bumiputera, Chinese, and Indian populations. Yet it was only in 2020, in MP12 (EPU, 2020) that Malaysia set a target for narrowing the ethnic income gap, only for its successor, MP13, to omit any follow-up (Ministry of Economy, 2025).

The inconsistent manner with which income inequality has been handled is at odds with the mission of reducing interethnic disparities. This article revisits Malaysia’s inequality record, with a focus on dimensions overlooked in the policy discourse, and discusses the morphing scope and salience of household income in public policy. The analysis finds two main omissions:
  • First, a lack of consistency in framing the problems and objectives, which has forestalled coherent policy focus, especially the sporadic focus on the bottom and middle strata without follow-through, and the homogenization of the Bumiputera population.
  • Second, inadequate attention to interethnic inequalities within income strata (bottom, middle, and upper) and by area type (urban and rural), which has weakened attention to structural factors of inequality and precluded a fuller picture of policy progress.

The major cities are home to the rich and the poor, Kuala Lumpur, 2019.
Source: Shutterstock photo. Asset id: 1869019306


The framework and narrative of interethnic inequality warrant a reset, and Malaysia has already started the process—albeit partially and implicitly—by emphasizing economic policies for lower-income segments, Sabah and Sarawak indigenous populations, and minority groups. A revised set of interethnic household income inequality measures, including disaggregation by income strata (bottom, middle, and upper), area type (urban and rural), and Bumiputera subcategories, would be the place to start.

An inconsistent and disjointed record

Although the immediate post-independence administration is often characterized as taking a laissez-faire approach, its economic policies of the first phase—as Malaya (1957–1963) and then Malaysia (post-1963)—focused on rural development and regional inequalities. It also adhered to the constitutional stipulation of preference for Malays in the provision of school and university scholarships, public sector employment, and business permits and licences (Lee, 2022). By the mid-1960s, the government faced mounting pressure to explicitly promote Bumiputera advancement by facilitating upward mobility and expanding participation and ownership in commerce and industry. Some measures were introduced in the latter half of the decade, but the policy framework largely eschewed ethnicity-based policies.

The NEP, crafted in the aftermath of the 13 May 1969 ethnic riots, comprehensively transformed Malaysia. Incorporated into MP2, the NEP declared a two-pronged national mission to: 
  • Reduce and eventually eliminate poverty irrespective of race; and
  • Accelerate social restructuring to correct racial economic imbalance by reducing and eventually eliminating the identification of race with economic function, and redistribute equity ownership.
The first prong spanned the policy gamut, from education to employment, urbanization, and industrialization. Economic policy generated growth and diversification that developed the modern urban sectors while uplifting the traditional rural sectors.

The second prong focused on Bumiputera participation and capability. It overlapped with urbanization, industrialization, and other objectives of the first prong, but radically introduced direct and robust measures, primarily quotas and exclusive programmes for the Bumiputera. The Bumiputera preferential policies already in place since independence—in scholarships, public sector employment, and permits and licences—would be massively expanded to higher education admissions, government contracting, state-owned enterprises, business loans, unit trust funds, equity ownership rules, and more.

In line with this framework and data availability, MP2 set out three defining NEP targets: lowering the income poverty rate, reconfiguring the ethnic composition of occupations, and redistributing equity ownership such that 30 per cent would be held by Bumiputera individuals or institutions (equity ownership calculations were completed by 1971). More specific income-based targets would be issued in subsequent development documents. The Mid-term Review of MP2, with the benefit of household income data from the post-enumeration survey of the 1970 population census, presented impressions of income distribution and more detailed ethnic profiles of occupations (EPU, 1973).

The NEP template and specific targets were cemented by MP3 (EPU, 1976). One chapter, ‘Outline Perspective Plan, 1971–1990’, detailed the NEP’s objectives and programmes. The 30 per cent Bumiputera equity ownership target was retained. Poverty rates were computed, and the nationwide rate of 49.3 per cent in 1970 would be reduced to 16.7 per cent in 1990. The NEP would strive for ‘racial balance’ and equitable shares in the representation of Malays in managerial and professional positions—implicitly, alignment with ethnic proportions in the population. While noting the higher Malay concentration in low-productivity and low-wage sectors, and reporting on average household income by ethnic group, MP3 refrained from setting interethnic income inequality targets.

The consistent monitoring of absolute poverty rates and Gini coefficients—computed for the country and each ethnic group—has maintained a focus on absolute poverty and inequality, at the national and intra-ethnic levels. While the measures used for monitoring poverty trends have been contested, including the determination of the poverty line income, they have generated important longitudinal trends.

The secondary importance accorded to interethnic income inequality at the NEP’s inception was justified given the pressing concerns over the high rates of absolute poverty. However, Malaysia missed opportunities to formulate a consistent framework for addressing income distribution more systematically. Two key issues merit attention.

First, the practice of aggregating all Bumiputera households, and reducing policy targets to the average of this expansive grouping, has precluded important attention to heterogeneity and stratification within this population. The omission of within-Bumiputera differences has become increasingly consequential as their share of the citizen population has continually increased—surpassing 70 per cent in 2025.

Interestingly, household income was disaggregated as early as 1981 (EPU, 1981). MP4 reported poverty rates for Malays and the main indigenous groups of Sabah (Kadazan, Bajau, Murut, and others) and Sarawak (Iban, Land Dayak, Melanau, and others). Thereafter, poverty rates or other income data for these groups could not be traced in planning documents for close to 30 years. In 2008, the Mid-term Review of the Ninth Malaysia Plan presented household income levels of the main Bumiputera groups (Kadazan Dusun, Malay, Bajau, Murut, and others in Sabah; Iban, Malay, Bidayuh, Melanau, and others in Sarawak) (EPU, 2008).

Within-group inequalities, especially for the Bumiputera, have been increasingly recognized, but not quantified, in national plans from MP11 onwards. The level and pattern of Bumiputera subgroup inequality remain under-reported. And a relook at inequality and mobility in Malaysia by the World Bank underscored the imperative of separately evaluating the lagging development of the Bumiputera communities in Sabah and Sarawak (World Bank, 2024).

Second, Malaysia has only sporadically examined interethnic inequality by income strata, which has hindered more precise empirical analysis and effective policy formulation. The B40 (bottom 40 per cent) segment, popularized by the New Economic Model as a seeming novelty in 2010, had appeared in past episodes. MP4 reported on income levels of the ‘lowest four deciles’ for 1976 and 1979 (EPU, 1981), using various data sources including the post-enumeration survey to the 1970 population census (Chander, 1973) and the 1977 agricultural census (DOSM, 1981).

MP5 made a finer comparison of income among the bottom 40 per cent of urban Bumiputera, Chinese, and Indian households (EPU, 1986), and MP6 mentioned that ‘income of the bottom 40 per cent of households, most of whom are in the rural areas, increased faster than that of the other groups’ (EPU, 1991). MP8 (EPU, 2001) provided detailed mean income levels of the B40, M40 (middle 40 per cent), and T20 (top 20 per cent) layers.

Despite showing some awareness of stratification and of these income distribution dynamics, the handling of interethnic household income inequality remained confined to the nationwide average. Since MP7, development plans have tracked Chinese-Bumiputera and Indian-Bumiputera mean income ratios (EPU, 1996). Notably, MP12, apparently for the first and only time, set a target for narrowing the ethnic gap, specifically, raising the Bumiputera-per-Chinese median income ratio from 0.73 in 2019 to 0.88 in 2025 (EPU, 2020).

The Ministry of Economy (2025) has used a time series of income variables by ethnic group, including the median, overall mean, and the mean within income strata (B40, M40, and T20). From these we can compute interethnic ratios in ways that shed light on Malaysia’s development experience (Figure 1).

The result, spanning five decades, points to declining inequality on the whole, with phases of Bumiputera catch-up in the 1970s to the mid-1980s and the post-1998 Asian Financial Crisis era into the 2000s, and plateauing inequality from the mid-1980s until that crisis and from the 2010s until the present. Due to inconsistencies in the datasets before 1984, care is required in extrapolating from the 1970s’ data points to 1984. Nonetheless, inequality reductions are observed between 1970 and 1979—plausible in light of the NEP’s extensive redistribution policies.

Figure 1 also illustrates the over-ambition of the MP12 inequality reduction target between 2019 and 2025. It is perhaps unsurprising that this performance indicator was dropped in MP13. However, there are various other constructive and impactful ways for interethnic income inequality to inform development policy.

Figure 1 Interethnic income ratio (median household income), 1970–2024
Sources of data: Author’s calculations from Ministry of Economy data series (https://ekonomi.gov.my/en/ socio-economic-statistics/household-income-poverty-and-household-expenditure) and DOSM’s Household Income Survey Report 2024.
Note: The data in this figure, and figures below, refer to gross household income (pre-tax income from all household members and sources, including earnings, property, and transfers).


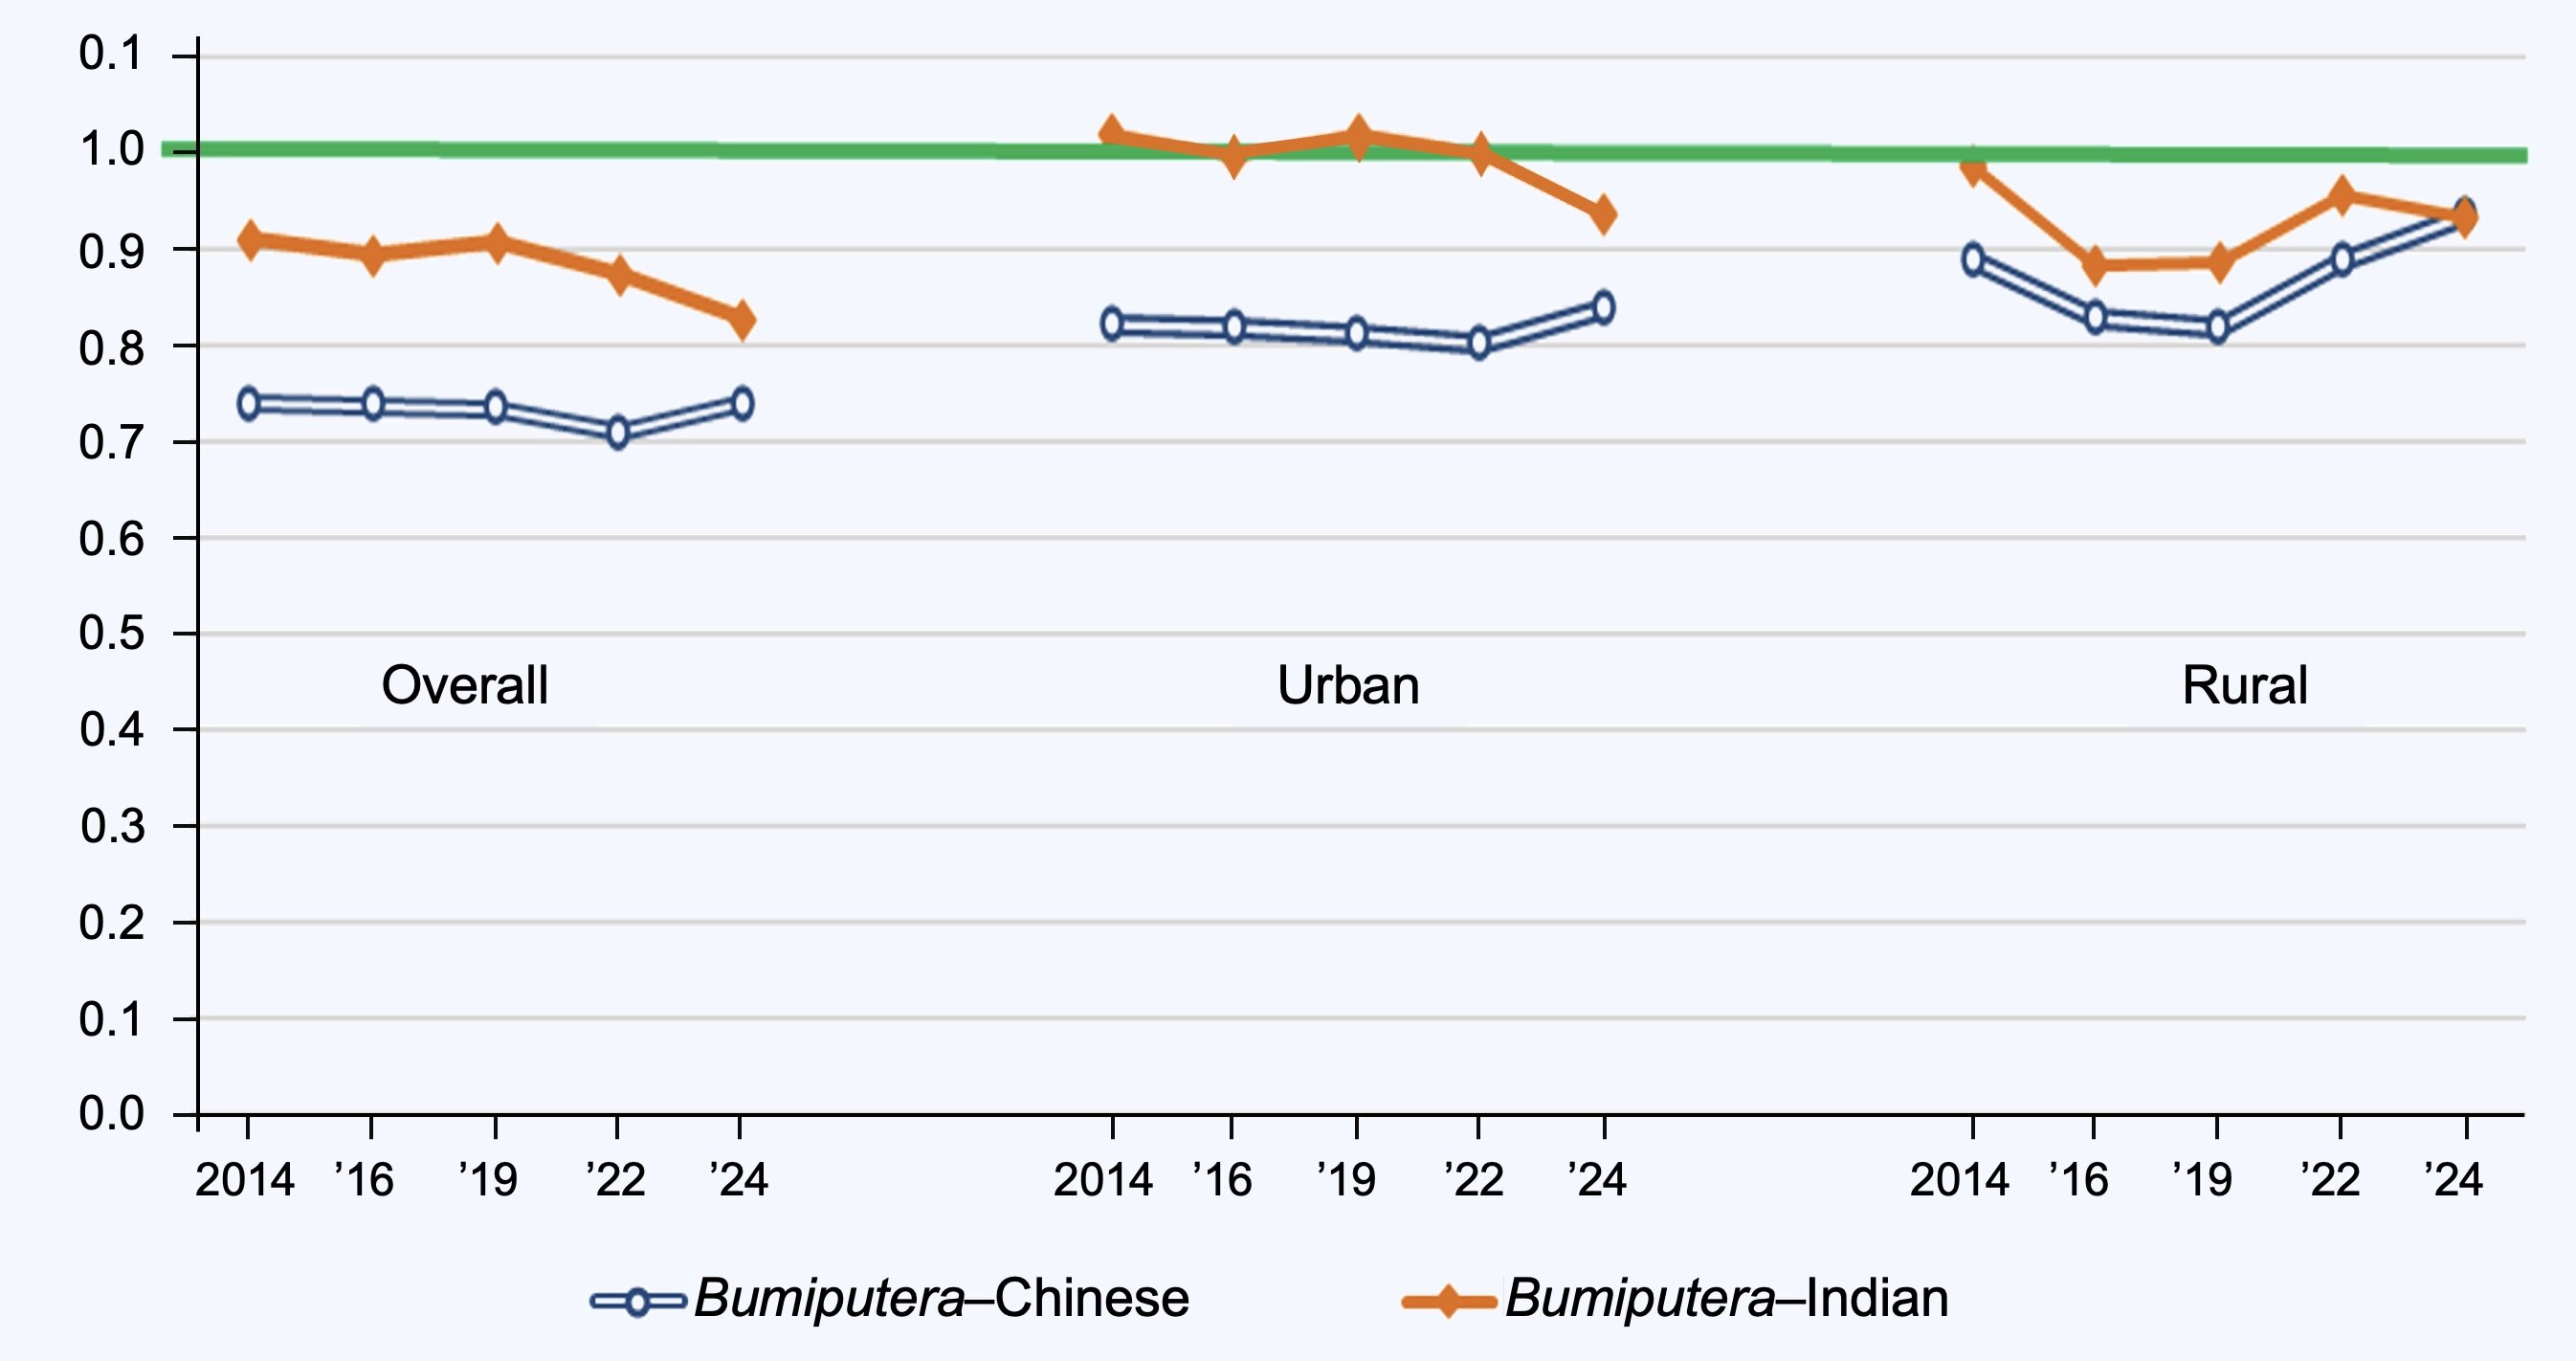
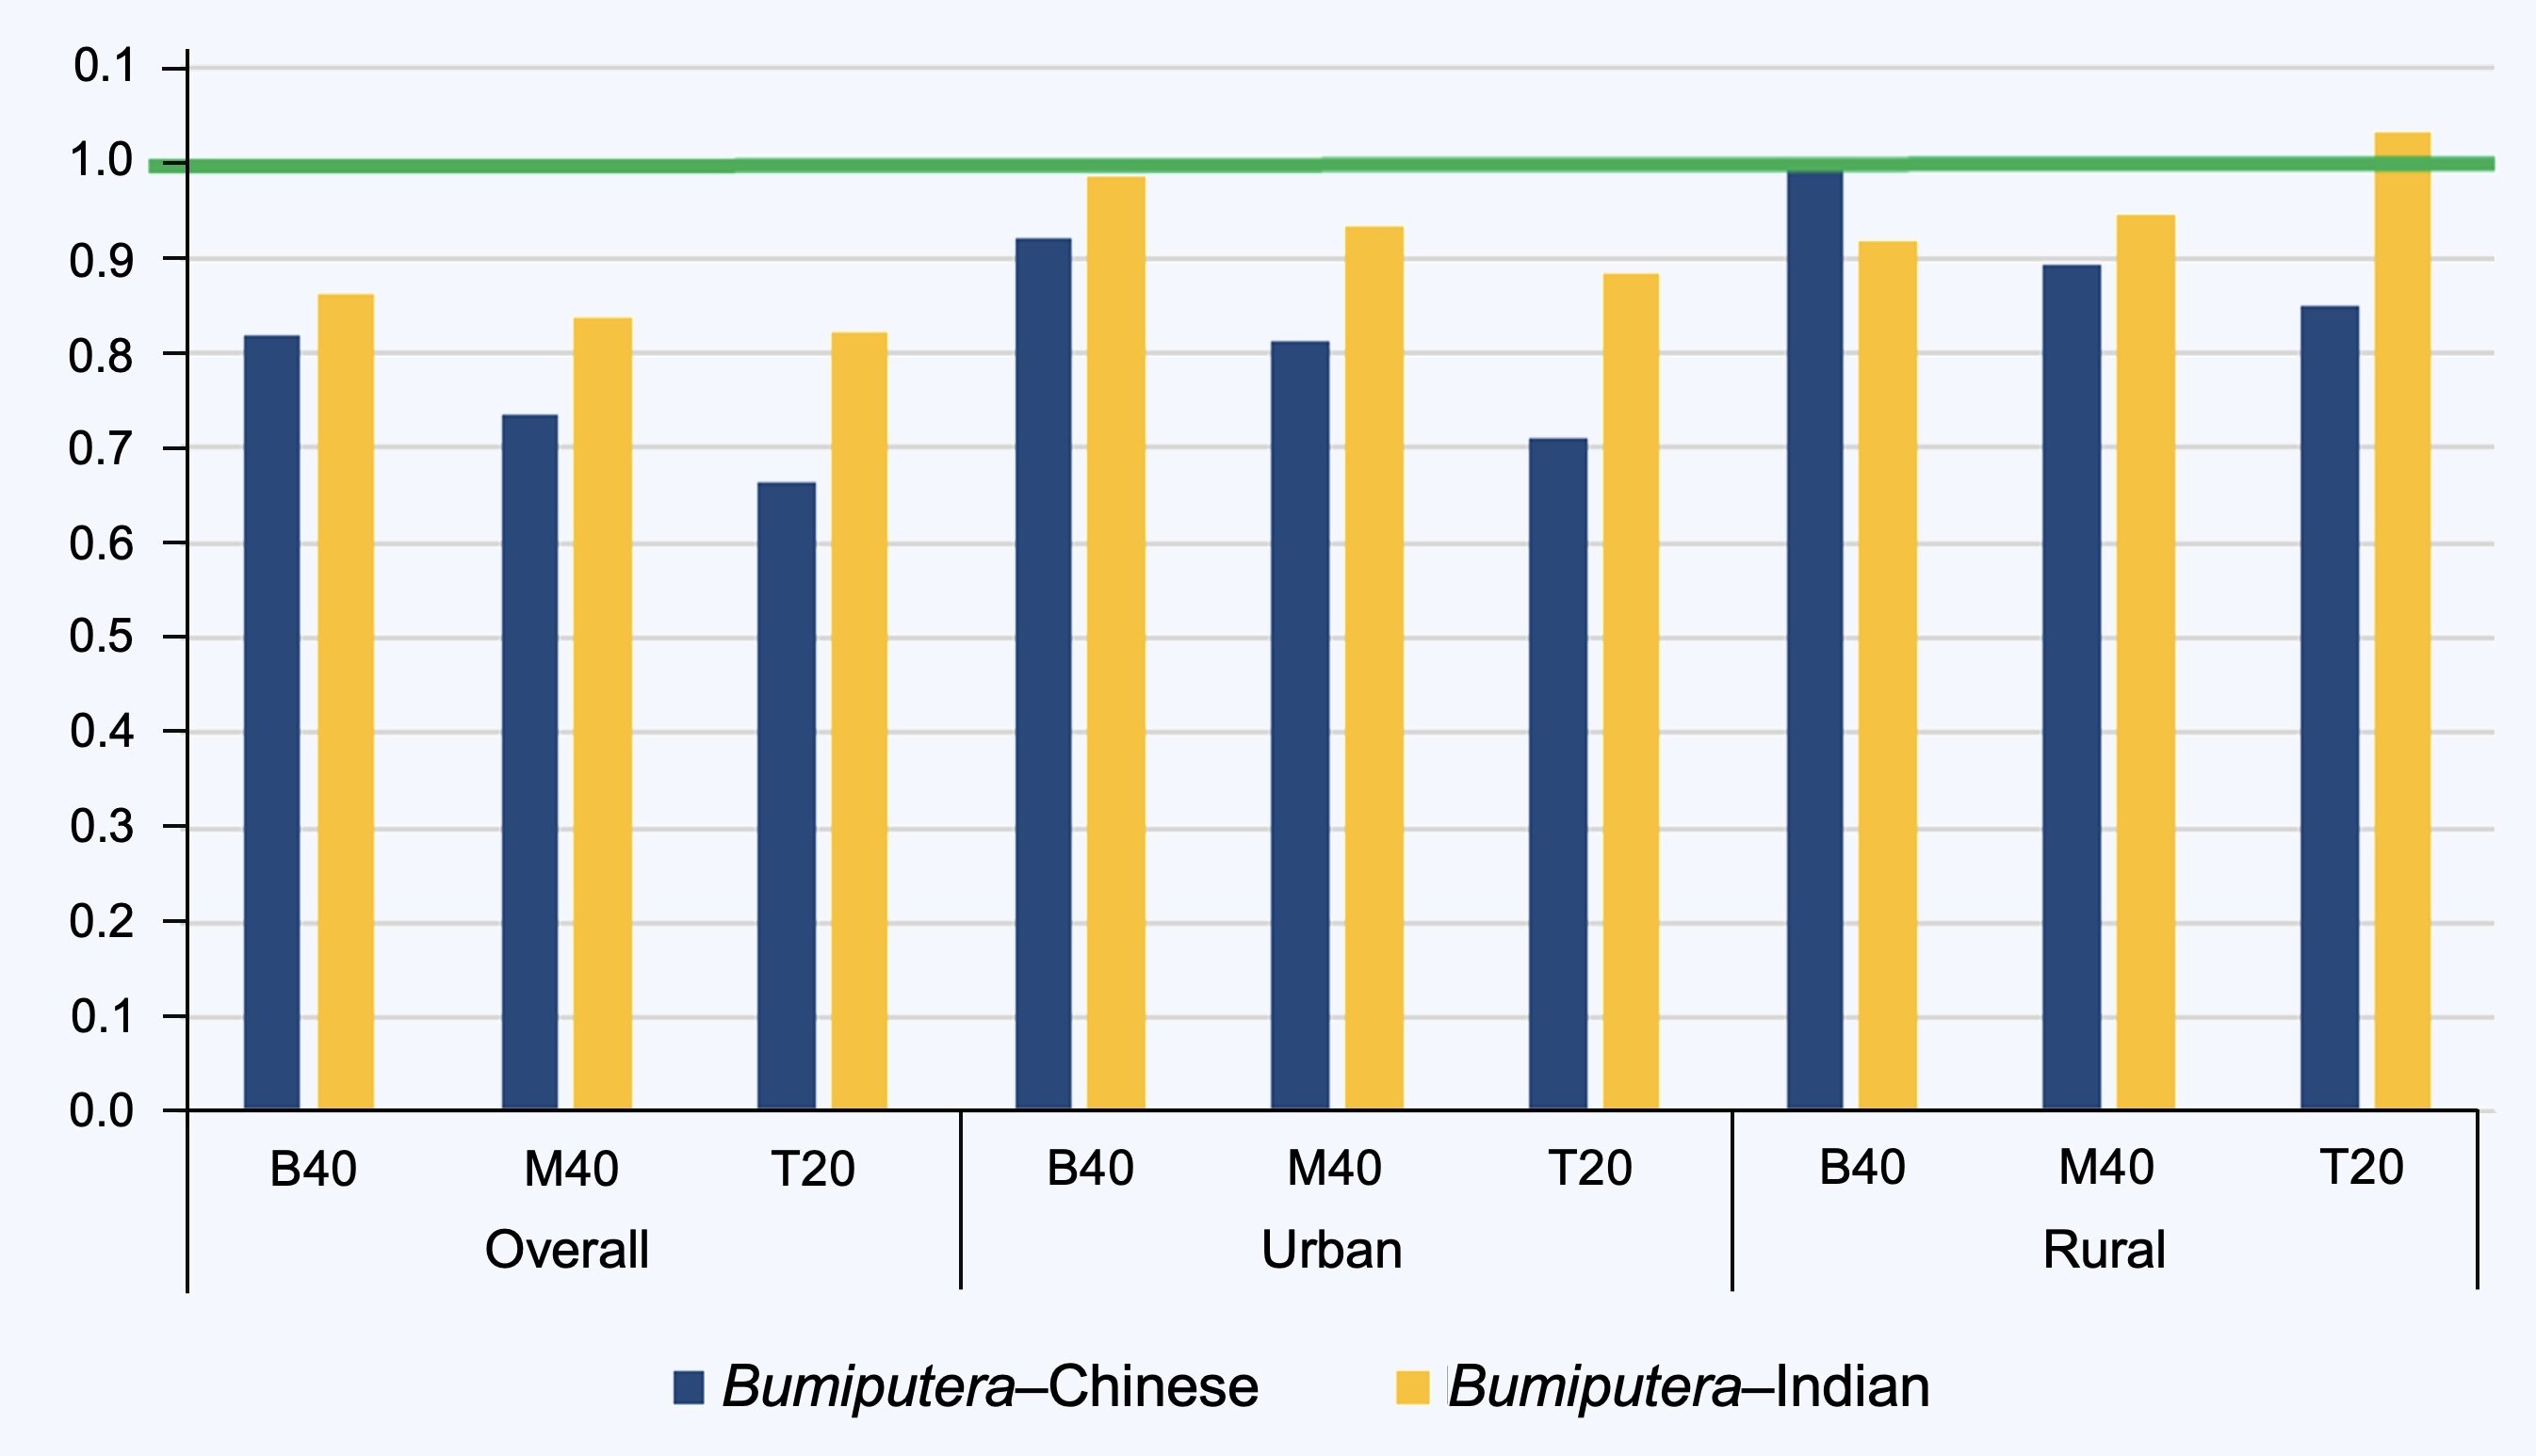
New narratives of income inequality

Malaysia holds a repository of household income statistics to guide empirical understanding and policy discourse. The story of interethnic income inequality relied for decades on Malaysia’s development plans—which, as argued above, gave an inconsistent and disjointed account. This section explores new narratives based on more detailed data published by the Department of Statistics–Malaysia (DOSM) in recent years. Some limitations remain, particularly the aggregation of the entire Bumiputera population, and the raw data are not accessible for researchers to probe deeper. Nonetheless, the publicly available household income statistics suffice to show potential directions to take.

The long-term track record based on median income (Figure 1) or mean income can be a starting point, but breaking down inequality further by strata (B40, M40, and T20) adds an important perspective. The Bumiputera–Chinese income ratio gap, which is widest, and economically and politically most salient, was fairly steady over the 2014–2024 period (Figure 1). However, B40 Bumiputera households steadily narrowed the income gap with B40 Chinese households (Figure 2). The B40 differential between Bumiputera and Indian households had for decades been wider than the corresponding measures for the M40 and T20, but the inverse transpired from around 2010 (Figure 3). Although the B40 Bumiputera to B40 Indian ratio has fluctuated in the 0.85–0.90 band for the past decade, this margin is smaller than for the other two categories.

Figure 2 Bumiputera per Chinese household income ratio, nationwide (mean income of B40, M40, and T20), 1979–2024
Sources of data: Author’s calculations from Ministry of Economy data series (https://ekonomi.gov.my/en/ socio-economic-statistics/household-income-poverty-and-household-expenditure) and DOSM’s Household Income Survey Report 2024.


Closing the interethnic gap is most warranted for households in the low-income brackets—a principle that accords with the NEP’s first prong of eliminating poverty irrespective of race. Any group’s concentration in low-wage jobs, omission from social assistance, or economic disadvantage in general, are social injustices that warrant redress. Malaysia’s income inequality record, revised by focusing on the B40, shows important gains in the past decade and a half that concur with the policy and programmatic priorities placed on the B40, including cash transfers and the minimum wage. Interventions in this space merit continued attention to enhance their outreach and efficacy.

Figure 3 Bumiputera per Indian household income ratio, nationwide (mean income of B40, M40, and T20), 1979–2024
Sources of data: Author’s calculations from Ministry of Economy data series (https://ekonomi.gov.my/en/ socio-economic-statistics/household-income-poverty-and-household-expenditure) and DOSM’s Household Income Survey Report 2024.


The ethnic disparities among M40 and T20 households have, in contrast to the B40 trend, stayed the same or slightly widened in recent years—the raw data are not accessible for researchers to probe deeper. Equitable ethnic representation across the labour market, including in high-skilled, technical, professional, and managerial occupations, should translate into reduced income disparities as per the NEP. However, the emergence of new economic growth sectors, skills requirements, and unexpected shocks such as the Covid-19 pandemic can impact on income distribution, including ethnic dimensions. The complexity and context-specificity of underlying factors underscore the value of viewing interethnic disparity layer by layer.

The highly aggregated view of inequality in the official records has also omitted the consequential differences between urban and rural populations. Malaysia has continuously urbanized, with 80 per cent of the population urban by 2024. The ethnic patterns of urbanization are clear. Based on the working-age population (15–64 years) in 2024, the urbanization rate was 70 per cent for Bumiputera, 94 per cent for Chinese, and 93 per cent for Indians. Bumiputera constituted 63 per cent of the working-age population in urban areas, compared with 91 per cent in rural areas (Malaysian citizens from DOSM, 2025).

While there is more of a continuum than a twofold segmentation between urban and rural settings, the economic activities and income levels of these binary categories remain marked and stratified. Comparing national aggregates dissolves these differences and skews the interethnic income ratios.

Separating urban and rural areas constitutes a simple but crucial modification to interethnic income inequality (Figure 4). As a result, the disparities in urban areas diminish—to near parity between Bumiputera and Indian households and above 0.80 for the Bumiputera–Chinese ratio—and these are more representative of the state of inequality, given that the vast majority of the Chinese and Indian populations live in urban areas. Rural interethnic disparity is also narrower than the overall disparity (with more fluctuation in the Bumiputera–Indian ratio, due to the small sample of Indian households).

Figure 4 Interethnic income ratio (median household income), by area type, 2014–2024
Sources of data: Author’s calculations from Household Income Survey Report (DOSM, various years).


Disaggregating the population further by area type and income strata for 2024 gives ethnic differentials for the B40, M40, and T20 categories separately for urban and rural areas (Figure 5). Even more starkly than seen in Figures 2 and 3, there is a shrunken urban B40 gap: the Bumiputera–Indian ratio is at parity, and the Bumiputera–Chinese ratio exceeds 0.90. A clear implication of these findings is the similarities in B40 urban incomes in general, which affirms the case for well-being policies that reach all groups, alongside targeted policies for expanding economic participation and upward mobility for the Indian community.

Figure 5 Interethnic mean household income ratios (B40, M40, and T20), by area type (2024)
Sources of data: Author’s calculations from Ministry of Economy data series (https://ekonomi.gov.my/en/ socio-economic-statistics/household-income-poverty-and-household-expenditure) and DOSM’s Household Income Survey Report 2024.


Conclusion

Malaysia’s aspiration to reduce ethnic inequalities, shaped by the NEP’s objective of eliminating the identification of race with economic function, has centred on Bumiputera labour market participation—particularly in professional and managerial positions—and equity ownership. The omission of ethnic equity holdings in MP13—replaced by a focus on meaningful and effective ownership—signals the possible fade-out of the 30 per cent Bumiputera equity target as a driving objective.

Household income disparities have been implicitly but inconsistently incorporated into national policy. The case for rethinking income inequality has perhaps already been foreshadowed by the shifts in policy orientation in recent development plans. The increased emphasis on low-income households, proxied by the B40, calls for interethnic gaps to be examined by income stratum. The increased recognition of specific policies for Malays, the other Bumiputera in Sabah and Sarawak, and the Indian and the peninsula’s Orang Asli communities, should be met with empirical accounting of the groups’ income situations.

Writing new narratives demands both a set of aspirations and targets beyond monolithic national averages, and national conversations drawing on the inequality patterns highlighted here
Low income most prevalent among Sabah’s indigenous population, 2015.
Source:
Shutterstock photo. Asset id: 1874262811 
Further reading:

Chander, R. 1973. An Interim Report on the Post Enumeration Survey 1970. Kuala Lumpur: Department of Statistics Malaysia.

Department of Statistics–Malaysia (DOSM). [various years]. Household Income Survey Report. Putrajaya:

______ 1981. 1977 Census Of Agriculture Malaysia : Main Report. Kuala Lumpur: Department of Statistics-Malaysia

______ 2025. Labour Force Survey Report 2024. Putrajaya: DOSM.

Economic Planning Unit–Malaysia (EPU). 1971. Second Malaysia Plan, 1971–1975. Kuala Lumpur: Government Printers.

______ 1973. Mid-Term Review of the Second Malaysia Plan, 1971–1975. Kuala Lumpur: Government Printers.

______ 1976. Third Malaysia Plan, 1976–1980. Kuala Lumpur: Government Printers.

______ 1981. Fourth Malaysia Plan, 1981–1985. Kuala Lumpur: Government Printers.

______ 1986. Fifth Malaysia Plan, 1986–1990. Kuala Lumpur: Government Printers.

______ 1991. Sixth Malaysia Plan, 1991–1996. Kuala Lumpur: Government Printers.

______ 1996. Seventh Malaysia Plan, 1996–2000. Kuala Lumpur: Government Printers.

______ 2001. Eighth Malaysia Plan, 2001–2005. Putrajaya: Government Printers.

______ 2008. Mid-term Review of the Ninth Malaysia Plan. Putrajaya: Government Printers.

______ 2020. Twelfth Malaysia Plan, 2021–2025. Putrajaya: Government Printers.

______ 2025. Thirteenth Malaysia Plan, 2026–2030. Putrajaya: Government Printers.

Lee, Hwok Aun. 2022. ‘Malaysia’s New Economic Policy: Fifty Years of Polarization and Impasse’. Southeast Asian Studies, Vol. 11, No. 2, August, pp. 299–329. DOI: 10.20495/seas.11.2_299.

Ministry of Economy. 2025. Thirteenth Malaysia Plan, 2026–2030. Putrajaya: Government Printers.

World Bank. 2024. A Fresh Take on Reducing Inequality and Enhancing Mobility in Malaysia. Washington, DC: World Bank.

Endnote:
1 Starting with the Second Malaysia Plan, 1971–1975 (MP2), which set out the NEP’s vision (EPU, 1971), the five-year national development plans have been the principal platforms for launching policies and programmes to reduce ethnic inequalities, and for publishing related monitoring statistics.

SHARE THIS PAGE
RELATED SITES

ECONOMIC HISTORY OF MALAYSIA
c/o Asia-Europe Institute
University of Malaya,
50603 Kuala Lumpur
Ooops!
Generic Popup2