The strongest El Niño in recorded history has formed in the Pacific Ocean. Historically, an El Niño, which contributes to global warming, had relatively little impact on food security in Malaysia (Box 1). Within Southeast Asia the major impacts have been drought in Indonesia, the Philippines, and southern Thailand, but Malaysia’s well-irrigated rice lands tend to produce at normal levels. However, a major impact on Malaysia is through the cost of rice imports because the world rice price almost always rises during significant El Niño episodes. The current ‘Super El Niño’ could well impact Malaysia through pricier rice imports, but the country’s status as a ‘multistaple food system’ should protect it from serious nutritional problems.
The most intuitive way to measure a multistaple food system is to calculate the ‘starchy staple ratio (SSR)’, the sum total of starchy staples relative to total caloric intake. In 2023, the last year for which data are available from the UN Food Balance Sheet (FBS), the starchy staple ratio for Malaysia was 0.36. It is composed of calories consumed from four starchy staples (rice, 700.5 kcal/cap/day; wheat, 300.4; maize, 51.7; and potatoes, 33.3, for a total of 1,085.9 kcal/cap/day). Average caloric intake by Malaysian consumers in 2023 was 3,000 kcal/cap/day—so the SSR was 0.36.
Starchy staple consumption in Malaysia is characterized by diversity: there are four significant commodities, one of which is completely imported (wheat). In sharp contrast, the SSR in Bangladesh is 0.80, of which 0.77 comes from rice (potatoes are eaten as a vegetable, but still count as a starchy staple). The SSR can also change significantly over time. Bennett’s Law stipulates that the SSR declines with rising income because of an ‘innate desire for diversity in the human diet’ (Bennett, 1954). Indonesia has a food system with many similarities to that of Malaysia. In 1976, the SSR for Indonesia was 0.77. By 2023, the country’s diet had diversified significantly and the SSR was 0.59.
The reality for Malaysia is that four significant starchy staples give its consumers considerable flexibility to change their consumption patterns when food prices change. Although this reality complicates efforts to manage Malaysia’s food economy—especially efforts to keep food prices stable—it does provide considerable resilience to the country’s consumers as they cope with rapidly changing food prices. This resilience will be extremely important as the full brunt of the Super El Niño is felt throughout Southeast Asia. Although Indonesia and the Philippines are usually the hardest hit from typical El Niños, Malaysia will not be spared from this one. Domestic rice production is likely to decline, at least slightly, and additional rice imports will be needed.
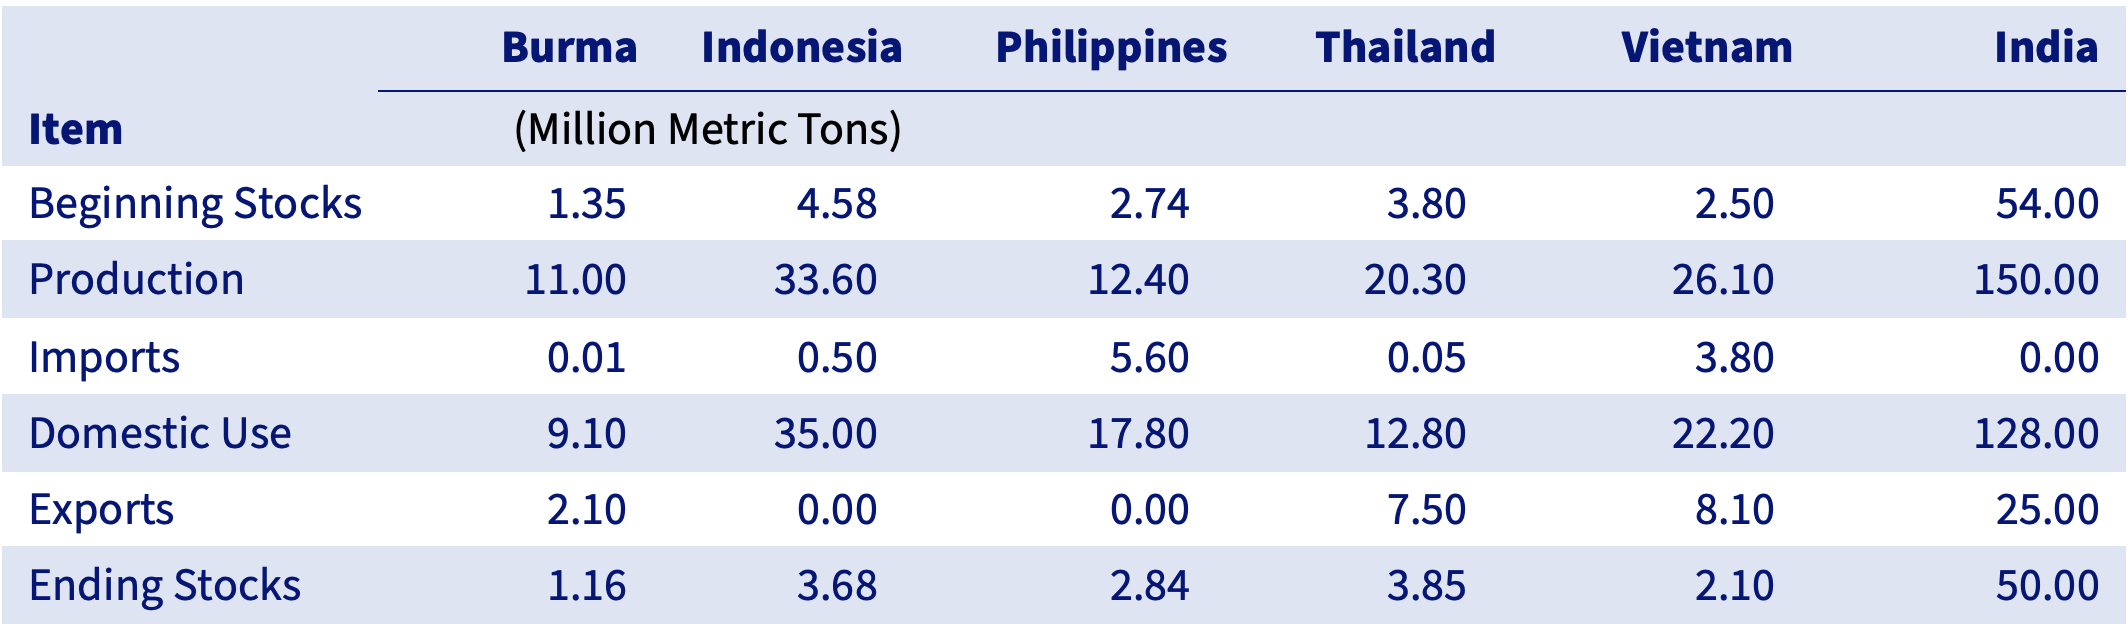
The most recent United States Department of Agriculture (USDA) analysis of the world rice market was released on 10 July 2026 (USDA, 2026). The results of most interest to Malaysia are shown in Table 1. The projection for marketing year 2026–27 is quite reassuring. The Philippines imported extra rice last year and expects to maintain its reserves in the coming year. It seems unlikely that there will be significant ‘panicked buying’ even in the face of the severe El Niño that is now underway.
Box 1: El Niños and Climate Change
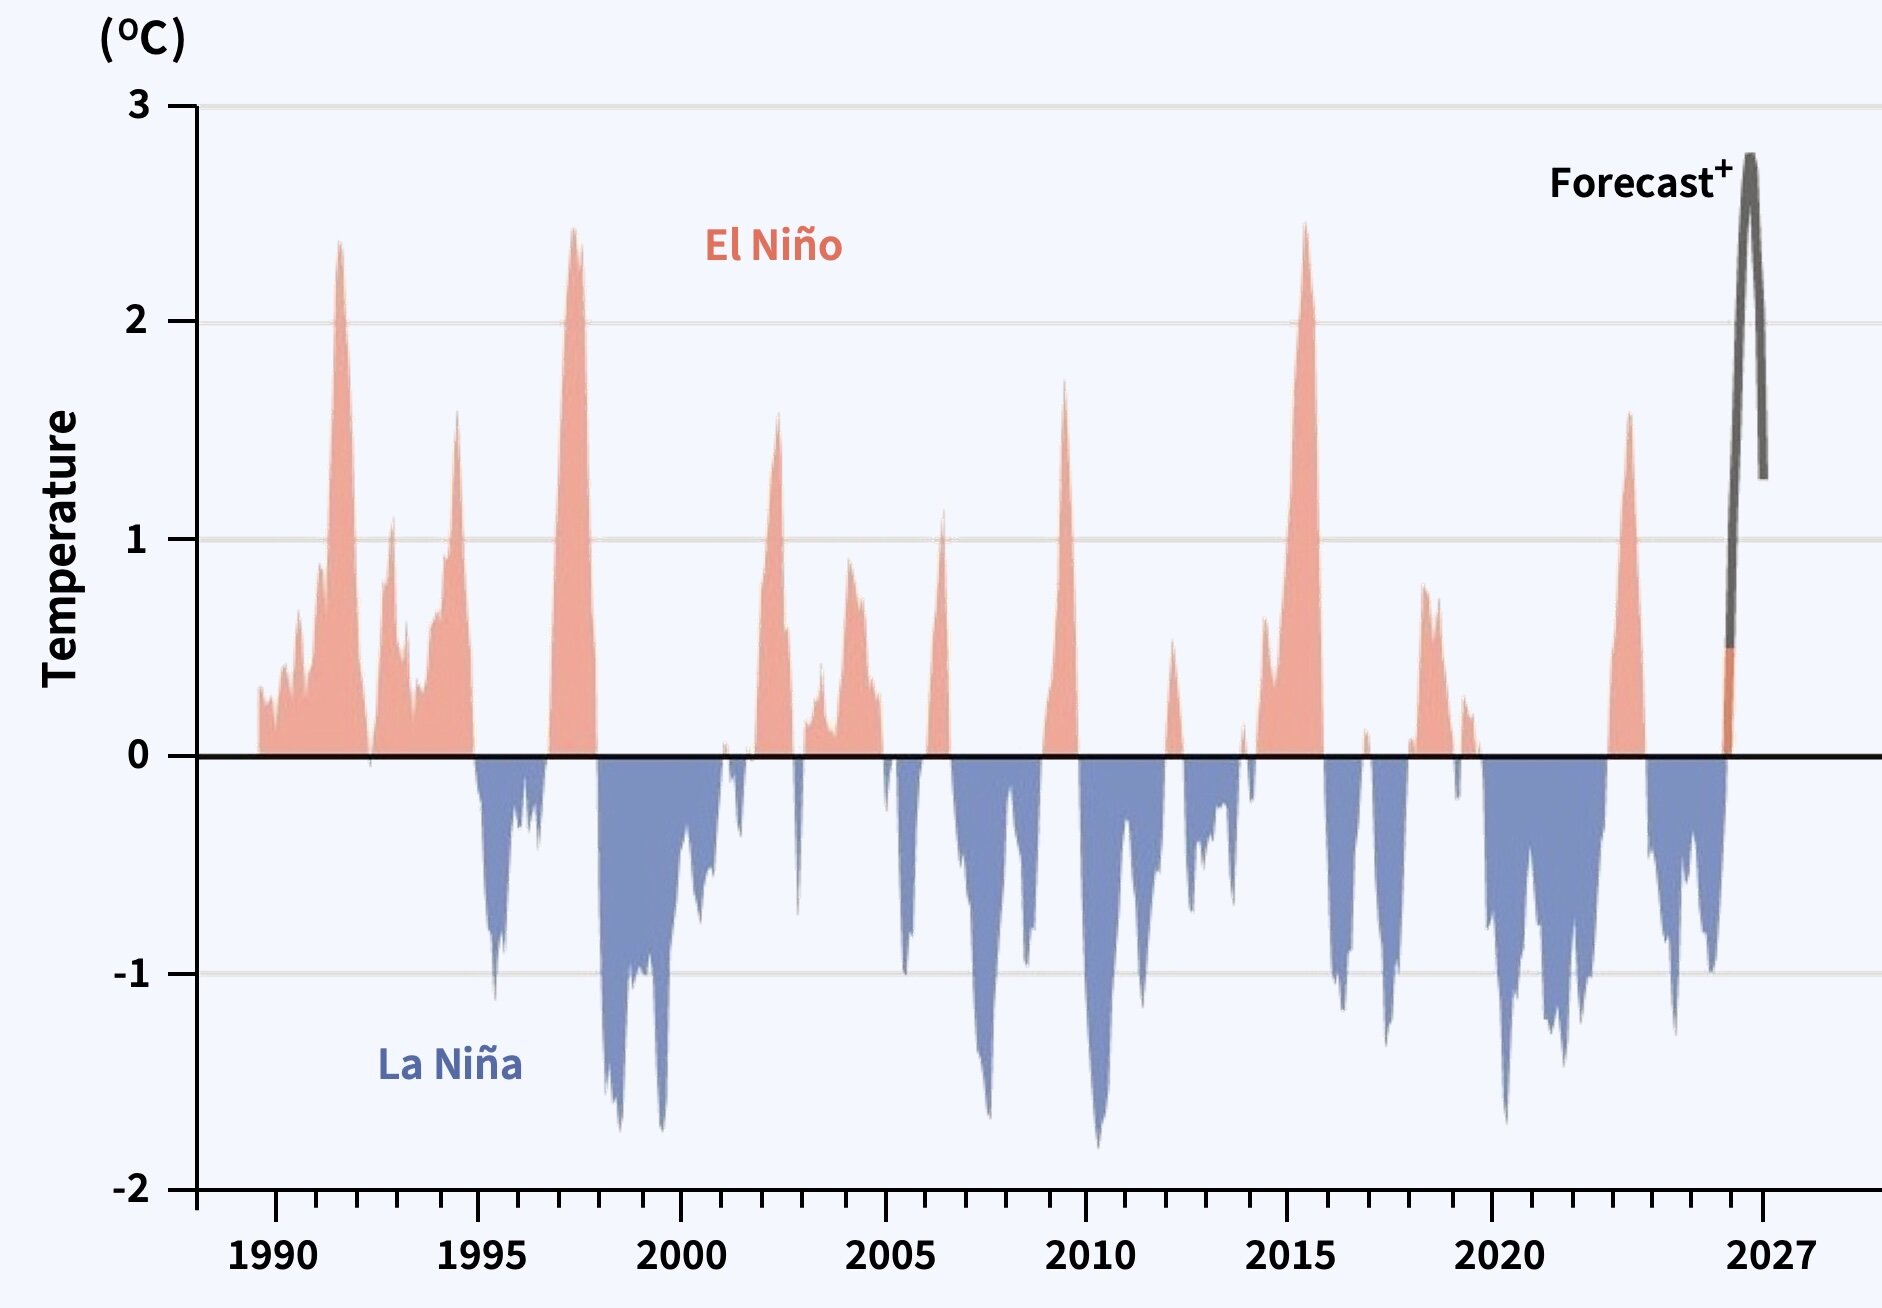
El Niño is driven by a shift in the winds above the eastern Pacific, which draws a band of warmer-than-average surface water into the ‘Niño 3.4’ region (map not reproduced). The strength of any particular El Niño is measured by how much warmer the water gets. Anything above a 2°C rise over the long-run average is considered strong. Forecasts from most of the world’s modellers for the rest of this year and the first couple of months of 2027 suggest a rise in sea-surface temperatures of more than 2.5°C—and perhaps even 3°C. That would be unprecedented in the 75 years for which scientists have been keeping records (the current record is held by the 1982–83 El Niño, when water temperatures rose 2.5°C). The Economist, 2026.
Box Figure 1 Niño 3.4 region, deviation from average sea-surface temperature*
Ali, D. H. A. 2024. ‘Food Security in Malaysia: An Empirical Analysis of Macroeconomic Determinants.’ International Journal of Academic Research in Economics and Management Sciences, 13(3): 176–187. https://doi.org/10.6007/IJAREMS/v13-i3/22076
Bennett, M. 1954. The World's Food. New York: Harper.
Department of Agriculture. 2021. National Agrofood Policy 2021–2030 (NAP 2.0): Point of View of the National Agrofood Crop Subsector. Putrajaya: Ministry of Agriculture and Food Industries.
Donnellon-May, G. 2026. ‘China's Summer Grain Harvest Surpasses 150 Million Tons for the First Time.’ Center for China Analysis, Asia Society Policy Institute, New York.
The Climate Brink. 2026. ‘Relative Oceanic Niño Index and multimodel median for Niño 3.4 region.’ The Climate Brink. Available at: https://theclimatebrink.substack.com
The Economist. 20 June 2026, pp. 68–69. ‘Boy Problems: The coming el Niño could be the strongest ever recorded.’
_______ 27 June 2026, pp. 70–71. ‘Another Sweltering Summer: Why Europe is the world’s fastest-warming continent.’
United States Department of Agriculture [USDA]. 2026. World Agricultural Supply and Demand Estimates (WASDE). July. Washington, DC: USDA. Available at: https://www.usda.gov/oce/commodity/wasde/wasde0726.pdf
Wallace-Wells, D. 2026. ‘We’re about to find out how prepared we are for climate change.’ The New York Times, 6 May. Available at: https://www.nytimes.com/2026/05/06/climate/we-are-prepared-climate-change.html
Zhong, R. 2026. ‘A Strong El Niño May Be Coming. Global Warming Is Changing Its Effects’, The New York Times, 4 May. Graphics by Harry Stevens. Available at: https://www.nytimes.com/2026/05/04/climate/el-nino-global-warming.html.